PROFILE
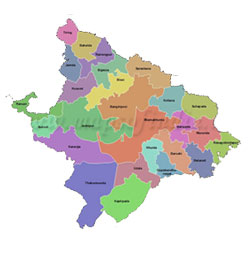
- Area: 10418 Sq. Kms
- Forest Area: 42.16%
- Blocks: 26 blocks, which covers 26 Tahasils,
- GPs: 404
- Villages: 3950
- Household: 03.26 lakh ST households (55.69% of total household).
- Population: 25.20 lakhs out of which 14.80 lakh (58.72%) are ST Population.
ITDA and Micro Projects
ITDA Baripada
Baripada ITDP was established in the year1974-75 and was registered as ITDA in the year 1979 under the Societies Registration Act, 1860. The ITDA is situated 210 35’ N to 220 15’N Latitude and 860 40’E to 870 15’E Longitude. The total geographical area of the ITDA area is 2724.25 sq.kms out of which about 226.64 sq.kms is covered by forest. The Jurisdiction of the ITDA, Baripada comprises of one revenue Sub-Division, 10 Blocks, 177 GPs and 1893 villages & one Microproject i.e LDA Morada. The 10 Blocks which comes under this ITDA are Bangiriposi, Baripada, Barasahi, Betanati, Kuliana, Morada, Rasgobindapur, Samakhunta, Saraskana & Suliapada,
The temperature of the area varies from maximum 45.60 to minimum 9.20 Celsius with average annual rainfall of about 1600.60 mm. The soil type is loose and loamy with tinges of red and black. The major crops grown in the ITDA area are paddy, mustard, arhar, vegetables, ground nut, oilseeds, sunflower and blackgram.
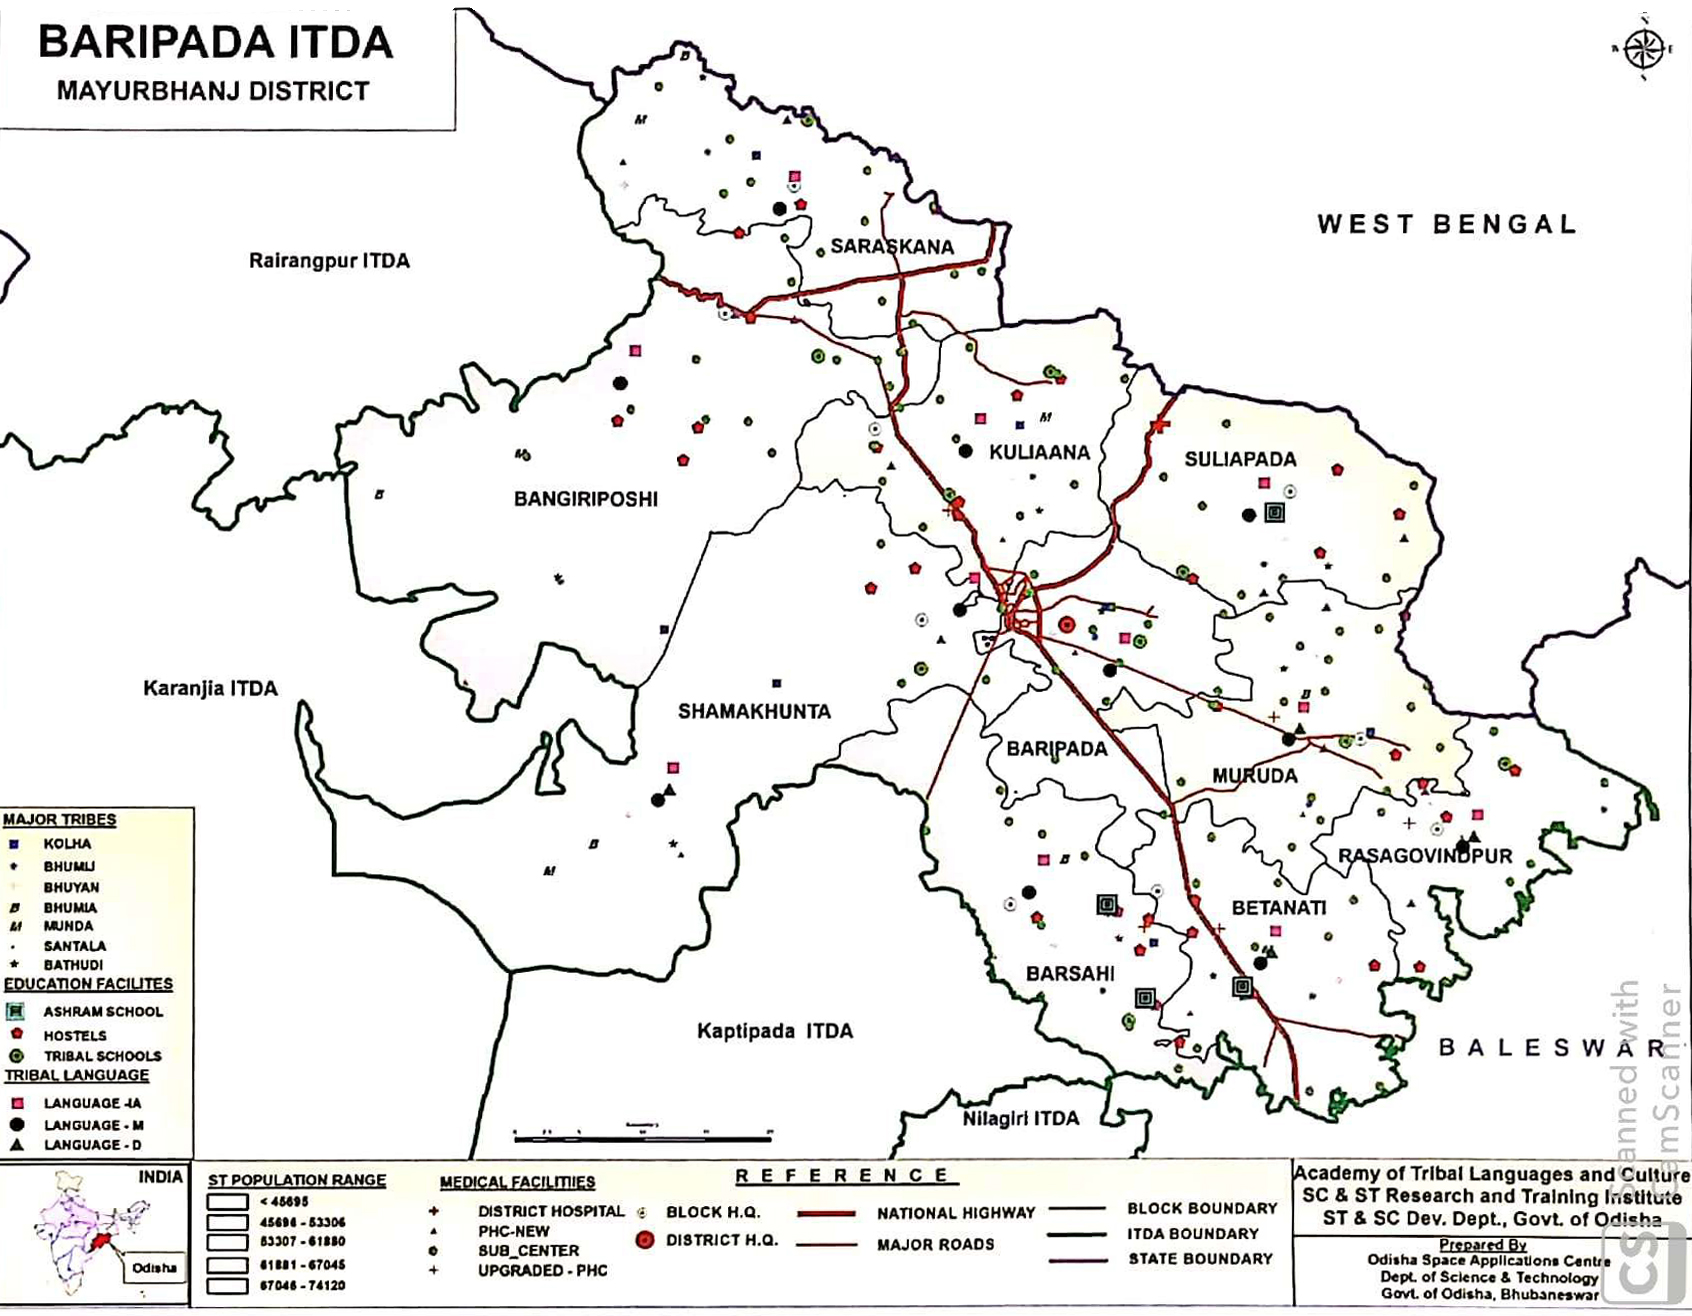
As per 2011 Census, the total household of the ITDA area is 2,49,972 and total population is 10,54,742 (Male-5,30,068 & Female-5,2,4674) out of which ST population is 5,78,605 (Male-2,89,370 & Female-2,89,235). The average household size of Baripada ITDA is 4. The total sex ratio is 990 females per 1000 males where as in case of ST it is 1000 and the total literacy rate of the area is 57.66% whereas ST literacy rate is 53.91%. Santal, Kolha, Bhumij / Bhumija, Bathudi, Munda, Kol, Mankirdia, Khadia, Lodha, Mahali are the major tribal communities living in the project area.
ITDA Kaptipada
Kaptipada ITDP was established in the year 1974-75 under TSP Guidelines which was registered as ITDA in the year 1979 under the Societies Registration Act, 1860. The ITDA is situated 200 20’ N to 210 56’N Latitude and 860 18’E to 810 51’ E Longitude. The geographical division of Kaptipada is covered by dense forest under the Similipal Reserve forest. The Jurisdiction of the ITDA Kaptipada comprises of one revenue Sub-Division, 4 Blocks, 64 GPs and 508 villages. The four blocks are Gopabandhu Nagar, Kaptipada, Khunta & Udala. The whole ITDA area has historical significance and Ghatsila and Haladighat deserves special mention. It is situated at Dhudhua-Ghatasila hill which is famous for Goddess Lakhi Chandi and another tourist place is “Khuda Patuli”, an oval stone, where Bhima pressed his knees, “Samibruksha” where five Pandavas hide their arms.
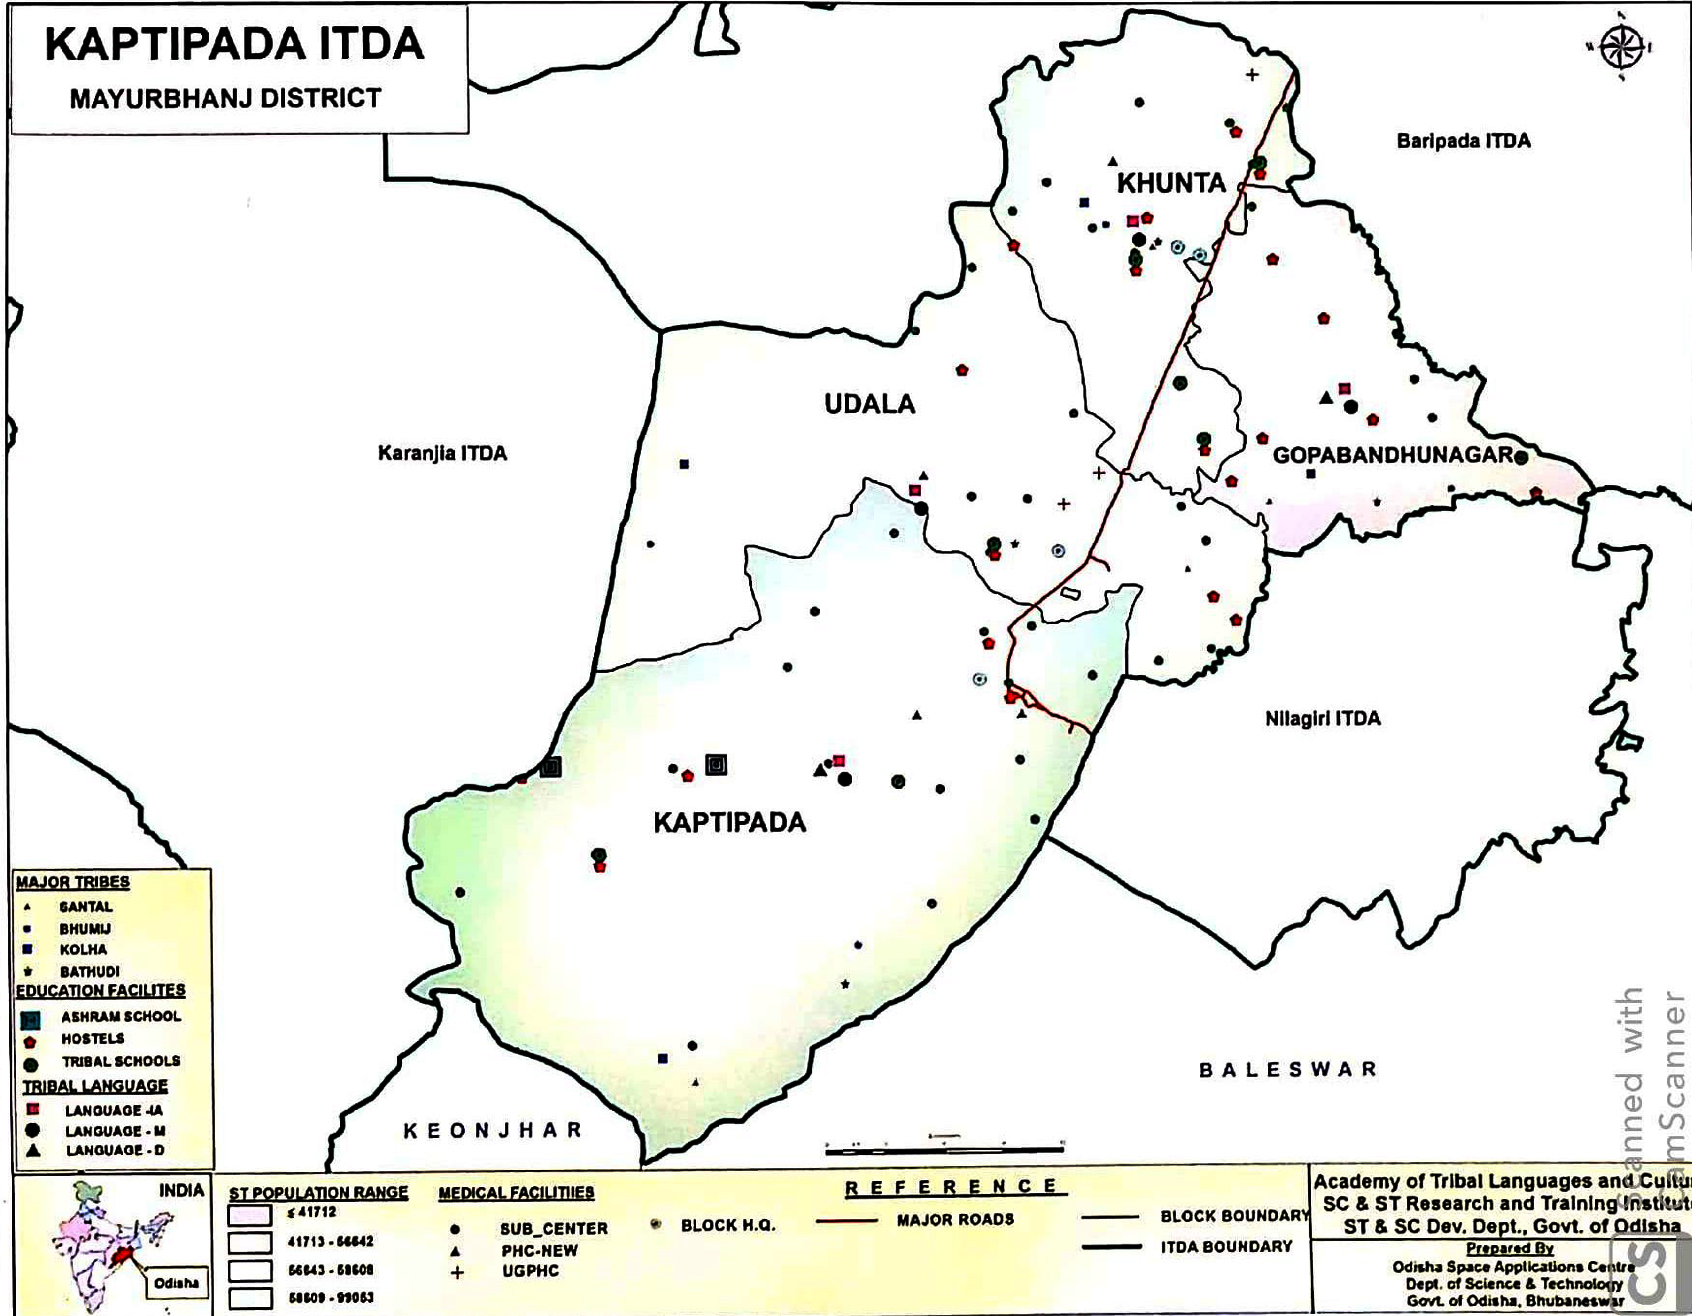
The total geographical area of the ITDA area is 10418 sq.kms out of which the forest area is 151.46 sq.kms. The temperature of the area varies from maximum 430 C to minimum 140 C with average annual rainfall of about 1393.5 mm. The soil type is Red lateritic & Alluvial soil. The major crops grown in the ITDA area are paddy, mustard, arhar & sabai grass.
As per 2011 Census, the total household of the ITDA area is 8,7046 and total population is 3,74,364 (Male-1,86,484 & Female-1,87,880) out of which ST population is 2,56,015, comprising of 1,26,728 & 1,29,287 Male and Female respectively. The average household size is 4. The population growth rate of the area (2001-2011) is 14.11% out of which ST growth rate is 17.08%. The total sex ratio is 1007 females per 1000 males where as in case of ST it is 1020 and the total literacy rate is 59.23% while ST literacy rate is 50.39%. Santal, Kolha, Bhumij & Bathudi are the major tribal communities living in the project area.
ITDA Karanjia
Karanjia ITDP was established in the year1974-75 under TSP Guidelines which was registered as ITDA in the year 1979 under the Societies Registration Act, 1860. The ITDA is situated 210 17’ N to 220 3’N Latitude and 850 40’E to 870 10’ E Longitude. The geographical area of Mayurbhanj is divided into two parts namely the Mountainous Terrain. of Similipal hill range area and the Un-dulating plain fertile lands. The Jurisdiction of the ITDA, Karnjia comprises of one revenue Sub-Division & two Tahasils (Karnjia & Raruan), 5 Blocks, 70 GPs and 758 villages and one Micro Project i.e. HKMDA Jashipur. The five Blocks are Jashipur, Karanjia, Raruan, Sukruli & Thakurmunda. Its boundary spreads over Baripada Sadar in the East, Rairangpur Sub-division in the West, Jharkhand state in the South.
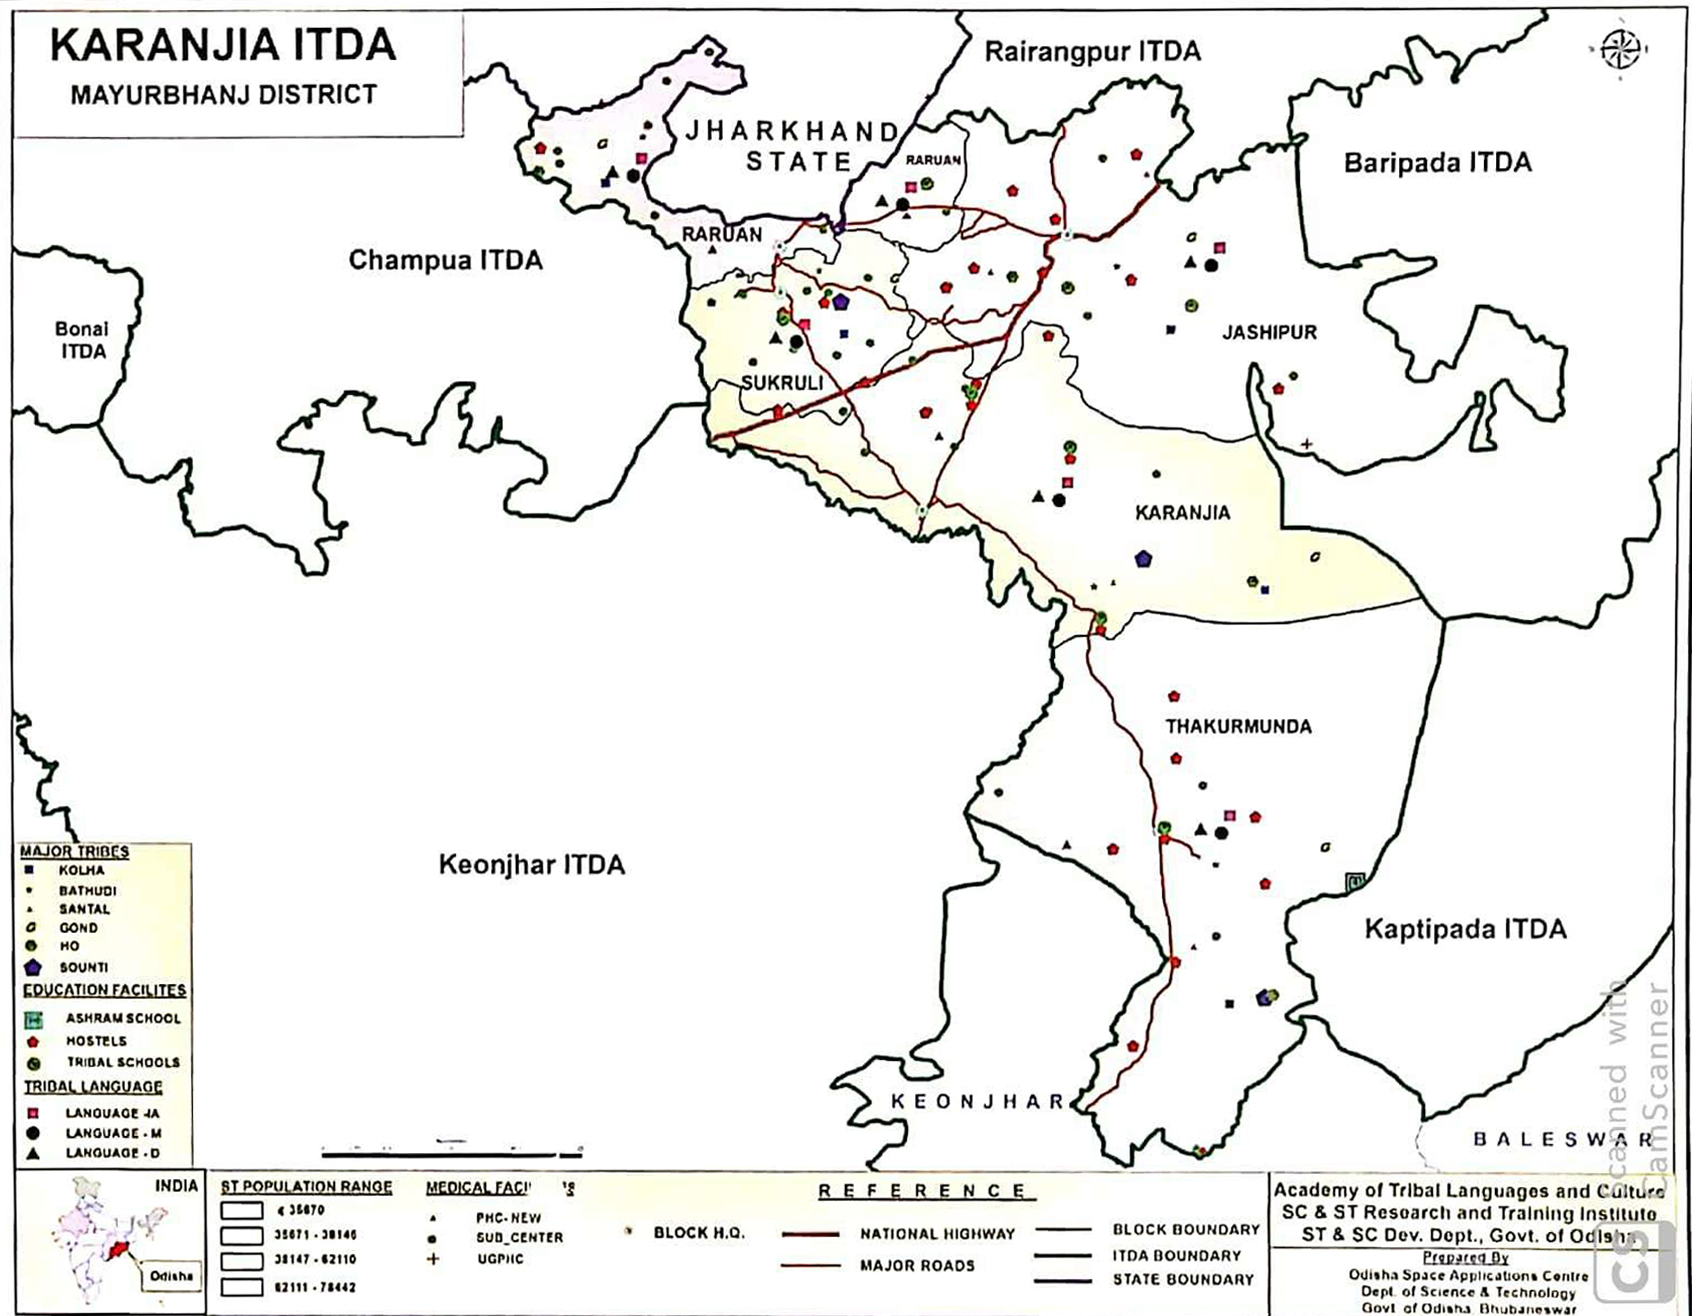
The total geographical area of the ITDA area is 3077sq.kms out of which forest area is about 201.95sq.kms. The temperature of the area varies from maximum 420 C to minimum 30 C with average annual rainfall of 1443mm. The soil type is Red lateritic, Rocky & Black cotton. The major crops grown in the ITDA area are paddy, oilseeds maize, arhar, sabai and vegetables.
As per 2011 Census, the total household of the ITDA area is 95,773 and total population is 4,24,351 (Male-2,09,308 & Female-2,15,043) out of which ST population is 2,84,889 (Male-1,39,318 & Female-1,45,571). The average household size is 4. The decadal growth rate of the population of the area (2001-2011) is 14.11% and ST growth rate is 26.66%. The total sex ratio is 1027 females per 1000 males where as in case of ST it is 1045. The total literacy rate of the area is 58.38% whereas ST literacy rate is 50.20%. Santal, Kol, Bhumij, Hill Kharia & Mankirdia, Munda, Bathudi, Sounti, Gond and Bhuyan are the major tribal communities living in this project area.
ITDA Rairangapur
Rairangpur ITDP was established in the year 1974-75 under TSP Guidelines which was registered as ITDA in the year 1979 under the Societies Registration Act, 1860. The ITDA is situated 200 N to 200 40’N Latitude and 850 54’E to 850.27’ E Longitude. The geographical division is divided into two parts namely the Mountainous Terrain. and the Similipal hill range area. Rairangpur has historical significance with Bahalada which is famous for Indra festival, Gorumahisani is a Mining center & Janda is famous for the Sri Gopal jiu math. The Jurisdiction of the ITDA Rairangpur comprises of one revenue Sub-Division, 7 Blocks, 71 GPs and 807 villages. The seven blocks are Bahalda, Bijatola, Bisoi, Jamda, Kusumi, Rairangpur & Tiring. Its boundary spreads over Baripada Sadar in the East, Singhbhum district of Bihar in the North-West and Jharkhand state in the South.
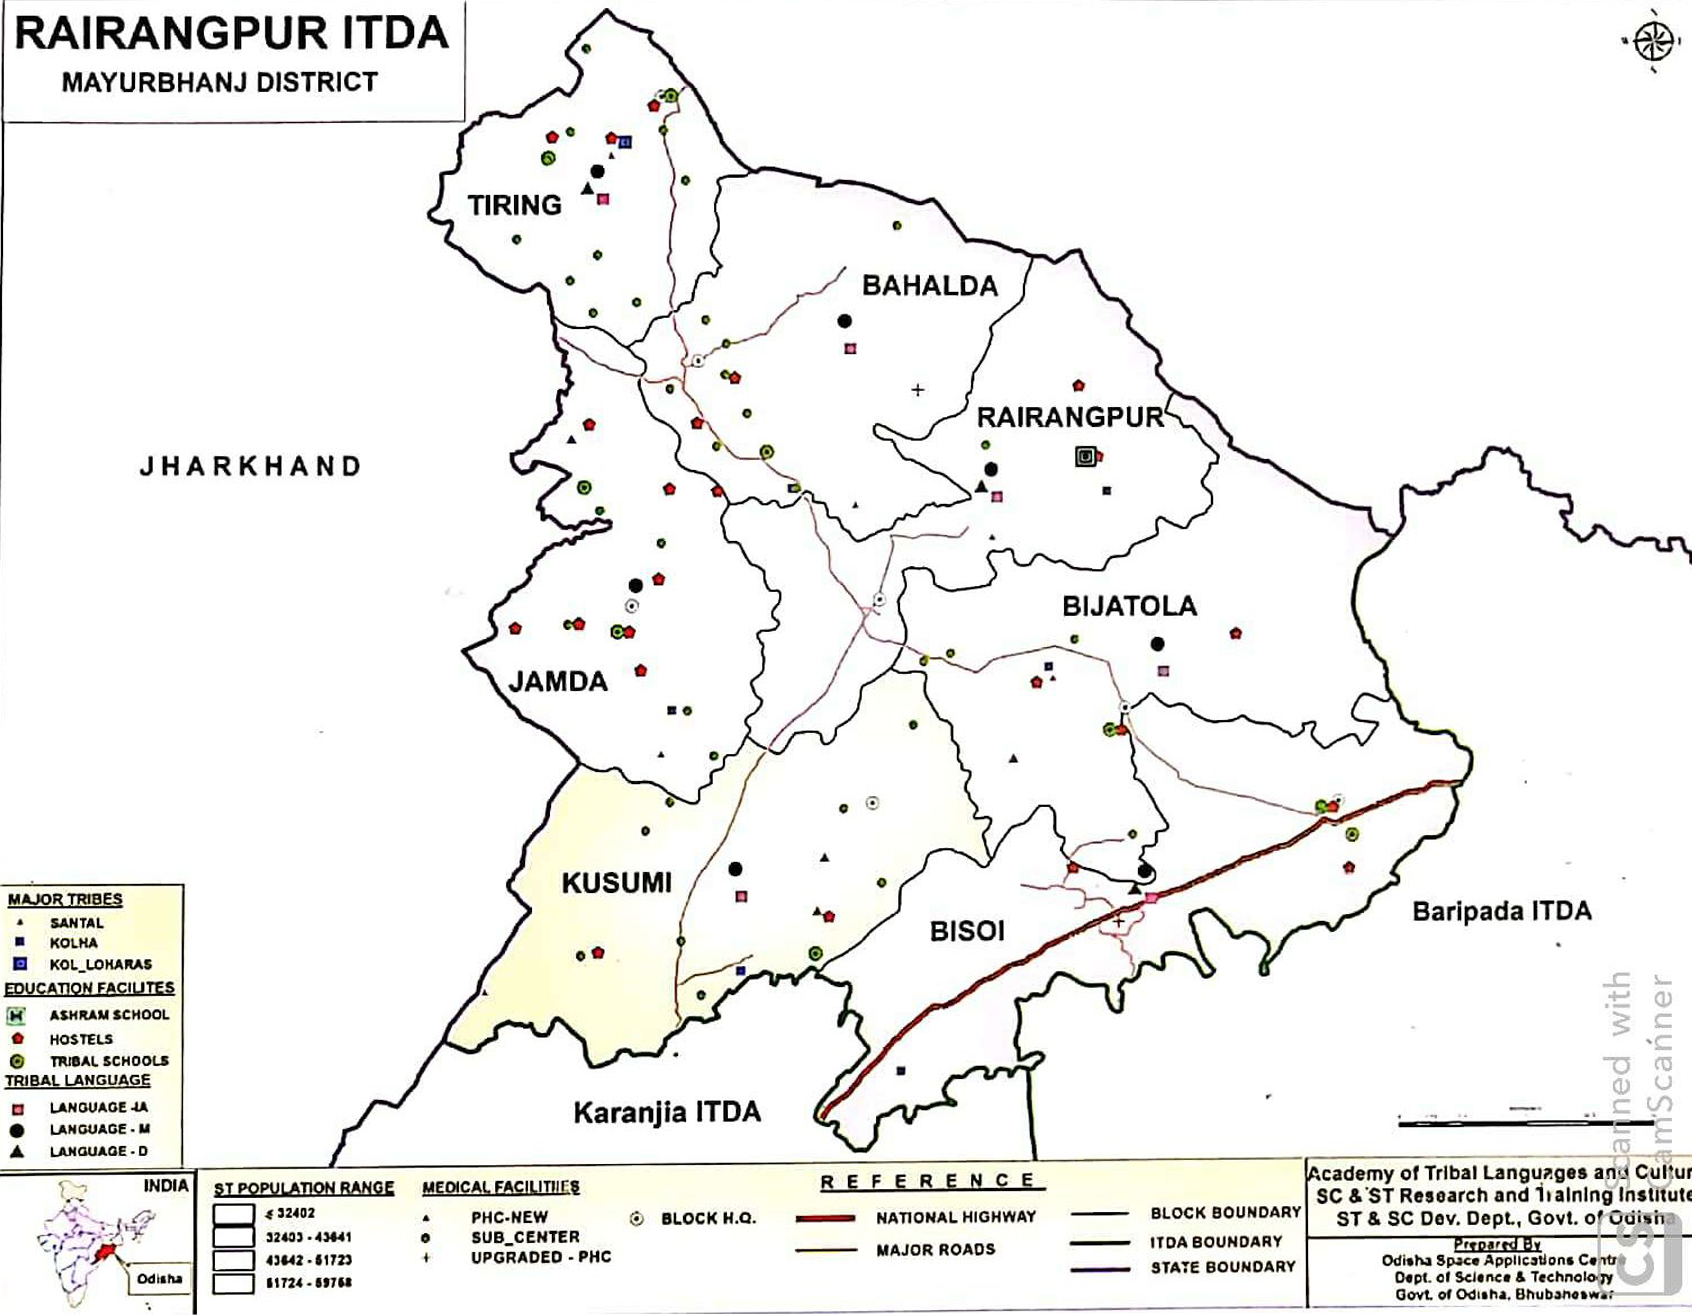
The total geographical area of the ITDA area is 1748 sq.kms out of which forest area is about 142.41sq.kms. The temperature of the area varies from maximum 45.40 C to minimum 90C with average annual rainfall of 433mm. The Soil of this area is alluvial laterite & black cotton in typel. The major crops grown in the ITDA area are paddy, pulses, fibre crops, sugarcane, cotton, tobacco and vegetables.
As per 2011 Census, the total household of the ITDA area is 1,14,978 and total population is 4,95,005 (Male-2,43,020 & Female-2,51,985) out of which ST population is 3,28,684 (Male-1,59,648 & Female-1,69,036). The average household size is 4. The decadal population growth rate (2001-2011) is 11.65% and ST growth rate is 12.55%. The total sex ratio is 1037 females per 1000 males where as in case of ST it is 1059 and total literacy rate is 60.80% whereas ST literacy rate is 54.17%. Santal, Kol, Bhumij, Kharia, Munda, Ho, Mundari and Bhuyan are the major tribal communities living in this project area.
Micro Project: Lodha Development Agency, Morada
Lodha Development Agency, Morada, was established during the 7th Five Year Plan (1985-86) and registered under the Society Registration Act, 1960. At present it is functioning at Morada, 15 kms away from Baripada. It spreads over 8 GPs in Suliapada and Morada Block of Mayurbhanj District. It comes under the jurisdiction of Baripada Sub division in the north, Medinapur in the east and the south west was surrounded by Baripada and Betanati Blocks. The total geographical area of the project is 25.23 sq. kms. It lies between 21˚.15 north latitude and between 86˚.80 east and 87˚.10 longitudes. The area receives an average rain fall of 1547.3mm. The type of soil found in the area is Red Lateritic .
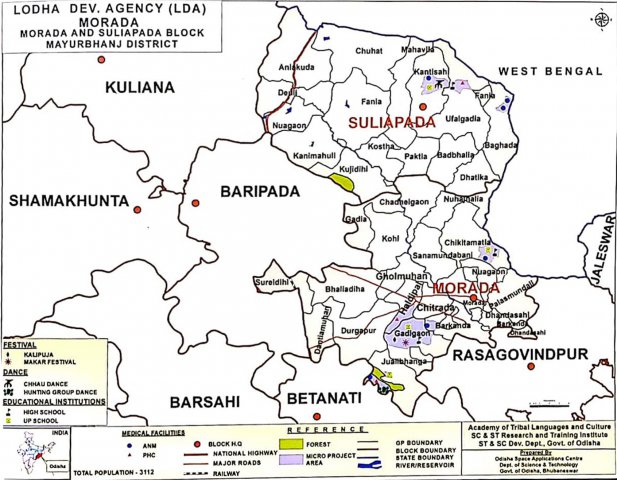
LDA Moroda covers 1103 Saora Households in 12 villages with a total population of 3541 (1823 male & 1718 female). The average household size is 3. The sex ratio is 942 per 1000 male. The population growth rate is (from 2010-15) 13.79% and total literacy rate of the Lodha is 37.98% (male-44.27% and female- 31.32%. The density of population is 140 per sq. kms. Lodha – an Indo-Aryan language is their mother tongue. People basically depend on cultivation and collection of sabai grass, paddy and minor forest produce for their survival. Settlement pattern is linear. Makar and Kali Puja are considered as major festivals. Major dance forms are Chhau Dance and Hunting Group Dance.
Micro Project: Hill-Kharia & Mankirdia Development Agency, Jashipur
Hill Khadia & Mankirdia Development Agency, Jashipur, was established in (1986-87) during the 7th Five Year Plan (1985-90) and registered under the Society Registration Act, 1860 on dtd. 10.02.1987. Presently it is functioning at Jashipur. It spreads over 12 GPs of Jashipur and Karanjia Blocks of Mayurbhanj District. It comes under the jurisdiction of Karanjia sub division and Karanjia ITDA of Mayurbhanj District. The total geographical area of the project is 129.78sq.kms. The average annual rain fall is 709.7 mm. The type of soil is Red Lateritic.
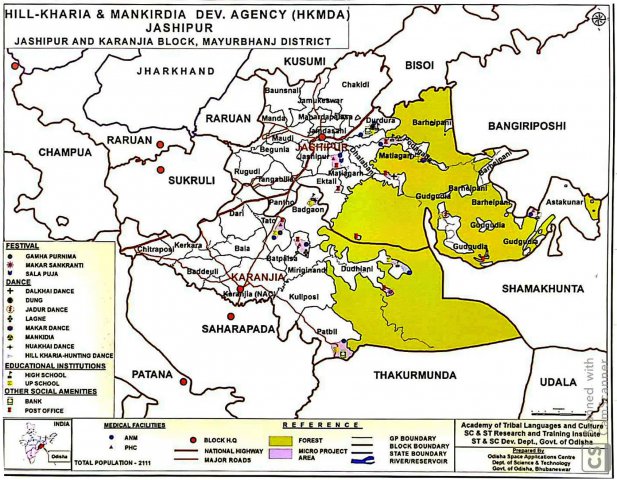
HKMD, Jashipur covers 756 Hillkharia, Mankirdia and Birhor Households in 18 villages with a total population of 2406 (1192 male & 1214 female). The average household size is 3. The sex ratio is 1018 female per 1000 male. The population growth rate is (from 2007-10) 13.97% and literacy rate 31.13% (male-33.39% and female-28.91%). The density of population of the area is 19 per sq. kms. Kharia Birhor (Mundari)-an astro Asiatic Language is their mother tongue. People basically depend on agriculture, collection of MFP, honey, siali leaves and wage earning. The settlement pattern of Hill Kharia is scattered and the housing pattern of Mankridia / Birhor is circular and cone shaped Leaf huts (Kumbha). Makar Sankrati, Gamha purnima, Sala Puja are major festivals. The major dance forms are Hill Kharia-Hunting dance, Makar dance, Nuakhai and Dal khai Dance. Mankridia-Dung, Lagne and Jadur Dance.
Demography and Development Indicators
Demography
An overview of the demography of the tribals as a whole in the district of Mayurbhanj shows that as per 2011 Census, the district has 14,79,576 tribal population out of which 7,49,089 are female & 7,30,487 are male. This shows that the sex ratio is in favour of the females in the district is 1025 female per 1000 male.
- Total population : 2519738 (Male-1256213 & Female-1263525)
- ST population : 1479576 (Male-730487 & Female-749089)
- Child population (0-6) : All-351834 & ST-235824
- Sex Ratio : All-1006 & ST-1025
- Child Sex Ratio : All-960 & ST-974
- Growth Rate : ALL-13.33 & ST-18.00
- Literacy Rate : All-63.17 & ST-53.11
- Female Literacy Rate : All-52.71 & ST-41.36
- Gender Gap in Literacy : All-21.05 & ST-23.91
- Worker (in lakh) : All-12.24 & ST-7.53
- WPR : All-48.56 & ST-50.88
- Scheduled Tribe Population
|
ST |
2001 |
2011 |
|
Total |
1258459 |
1479576 |
|
Male |
631149 |
730487 |
|
Female |
627310 |
749089 |
|
Child Poulation(0-6) |
229383 |
235824 |
During 2011, out of Total ST Population 49.37% are male and 50.63% female. The ST Child Population of the district is 67.03% of total child population of the district. Looking at the population growth rate of tribals as per 2011 Census, there is an increase of population of 18% between 2001 and 2011 Census over a period of 10 years. The work force participation rate indicates that 50.88% population are workers. The disaggregated data reveals that 54.57% and 47.28% are male and female workers respectively. Similarly, the dependancy ratio of total population of the district is 0.69 : 1,and for the ST category is 0.77:1.
- Education
During the last decade the literacy rate has been considerably increased. According to Census 2011 the literacy rate of the tribal population stands at 53.11% whereas the female literacy rate is 41.36%.
- Literacy Rate (Census-2011)
|
Category |
Total |
Male |
Female |
|
All |
63.17 |
73.76 |
52.71 |
|
Scheduled Tribe |
53.11 |
65.28 |
41.36 |
- Drop Out Rate (2016-17)
|
Category |
Primary |
Upper Primary |
Elementary |
|
All |
5.32 |
5.06 |
5.19 |
|
ST |
5.34 |
5.94 |
5.64 |
|
Girls |
5.11 |
4.28 |
4.70 |
- SSD Department Schools
|
Category |
Number |
|
High School |
42 |
|
Ashram School |
104 |
|
Educational Complex |
2 |
|
Sevashram (Res) |
1 |
|
Ekalavya Model Residential School (EMRS) |
1 |
|
Hostel |
963 |
Development Indicators
- Human Development Index (2001) : 0.639 (rank 09)
- Gender Development Index (2001) : 0.621 (rank 06)
- Infrastructure Development Index (2001) : 86.31 (Rank 22)
- Gross District Domestic Products ( At 2004-05 Price) : 481937 for 2009-10
- Dependency Ratio : All-0.69:1, ST-0.77:1 & SC-0.64:1
- Female Literacy Rate : All-52.71, ST-41.36 & SC-55.8
- Gross Enrolment Ratio
- Total : 101.81
- Primary : 102.31
- Upper Primary : 100.96
- Dropout Rate :
- Primary : All-5.32, ST-5.34 & SC-5.48
- Upper Primary : All-5.06, ST-5.94 & SC-9.28
- Elementary : All-5.19, ST-5.64 & SC-7.38
- IMR (As per Annual Health Survey 2012-13) : 47
- MMR (As per Annual Health Survey 2012-13) : 218
- CBR (As per Annual Health Survey 2012-13) : 19.7
- CDR (As per Annual Health Survey 2012-13) : 8.5
- Institutional Delivery (%) : 86
- Full Immunisation (%) : 67.8 :
- Nutrition Status
- Height-for-age : 43.5
- Weight-for-height- : 17.2
- Weight-for-age- : 43.8
- Average Land Holding : All Groups-0.92, ST-0.93 & SC-0.65
- Percentage of children having any anaemia (<11.0 g/dl)- : 34.5
- Percentage of women having any anaemia (<12.0 g/dl)1- : 42.4
- Women with BMI <18.5 (total thin)- : 31.6
- Women with BMI ≥25.0 (overweight or obese)- : 8.6
Districtwise Targets and Achievements of SDC
2018-19
|
Indicator |
Target |
|
Artisan Cards |
4480 |
|
Bilingual Dictionary |
3 |
|
Block Level Cultural Festival |
26 |
|
Block Level Sports |
26 |
|
Dance Costumes |
430 |
|
District Level Cultural Festival |
2 |
|
District Level Sports |
1 |
|
Exposure Visits |
2084 |
|
Musical Instrument |
430 |
|
Sacred Groves |
550 |
|
Skill Dev Training |
300 |
|
Sports Kit |
1610 |
|
State Level Sports |
1 |
|
Tribal Culture Clubs |
200 |
|
Tribal Museum |
1 |
|
Trilingual Proficiency Module |
3 |
|
Weekly Haat |
200 |
Office Bearers
-
Executive Committee
Executive committee for district:
No.
DESIGNATION
OFFICE BEARERS
1
Chairperson
District Collector
2
Member
Project Director, DRDA
3
Members
District Level Officers to be copted by the District Collector (District Level Officers should include deputy Director of Agriculture, CDMO, Cl of Schools, DFO, District Culture Officer, District Sports Officer, DWO, Special Officers of Micro Projects if any, DI & PRO)
4
Member
Director, DPMU
5
Member
Project Administrator (s), ITDA (s)
6
Member Secretary
The Project Administrator, ITDA located at the District Headquarter or located nearest to the District Head Quarter in case of the Districts having no Head Quarter ITDA
Major Tribes
-
 Bathudi
The Bathudi is one of the highly tribes of Odisha . More...
-
 Bhuyan
The ‘Bhuyan’ tribe is one of the major tribal communities of the district. More...
-
 Bhumij
Bhumij is another ST community of the district . More...
-
 Gond
GondGond is numerically the most dominant tribe of India . More...
-
 Ho
HoThe Ho is a Kolarian tribe belonging to the same stock of Munda. More...
-
 Kharia
Kharia is a tribal community who are found to be distributed in Jashipur . More...
-
 Kolha
KolhaThe name KOLHA is derived from the Monad word Kop. More...
-
 Lodha
LodhaLodha tribal community is found to be concentrated in Morada . More...
-
 Mahali
The Mahalis generally known for their bamboo work. More...
-
 Munda
MundaMUNDA is a major tribe of Odisha. More...
-
 Mundari
The Mundari is a part of Munda Tribe. More...
-
 Oraon
OraonThe Oraon is an agrarian tribe of Odisha. More...
Download: Communitywise and Sectorwise distribution of Schedule tribes