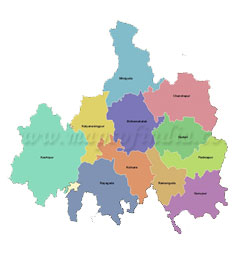
PROFILE
- Area: 7073 Sq. Kms
- Forest Area: 39.76%
- Blocks: 11 blocks, which covers 11 Tahasils,
- GPs: 182
- Villages: 2665
- Household: 1.22 lakh ST households (53.78% of total household).
- Population: 09.67 lakhs out of which 05.42 lakh (55.99%) are ST Population.
ITDA and Micro Projects
ITDA Raygada
The Integrated Tribal Development Project (I.T.D.P) comprising of Rayagada Block which came into operation from 29th August 1974. The other three blocks of Rayagada Sub-Division are namely Kolnara, K.Singpur and Kashipur and they were merged into Rayagada I.T.D.P in the Year 1976. Since then Rayagada I.T.D.P. and Rayagada Sub-Division became geographically co-terminus. Consequent upon its registration under Registration of Societies Act, 1860, it is redesignated as Integrated Tribal Development Agency (ITDA) from the year 1979-80. The ITDA is situated 190 0’ N to 190 58’ N Latitude and 820 54’ E to 190 58’ E Longitude. The total geographical area of the ITDA area is 1790.37 sq.kms out of which about 24652 sq.kms.is covered by forest. The Jurisdiction of the ITDA, Rayagada comprises of one revenue Sub-Division, 4 Blocks namely Rayagada, Kolnara,Kashipur and Kalyansinghpur, 76 GPs and 1196 villages & two Micro projects i.e Donogria Kandha Development Agency, (DKDA) Parsali , Lanjia Saora Development Agency, (LSDA) Puttasing .
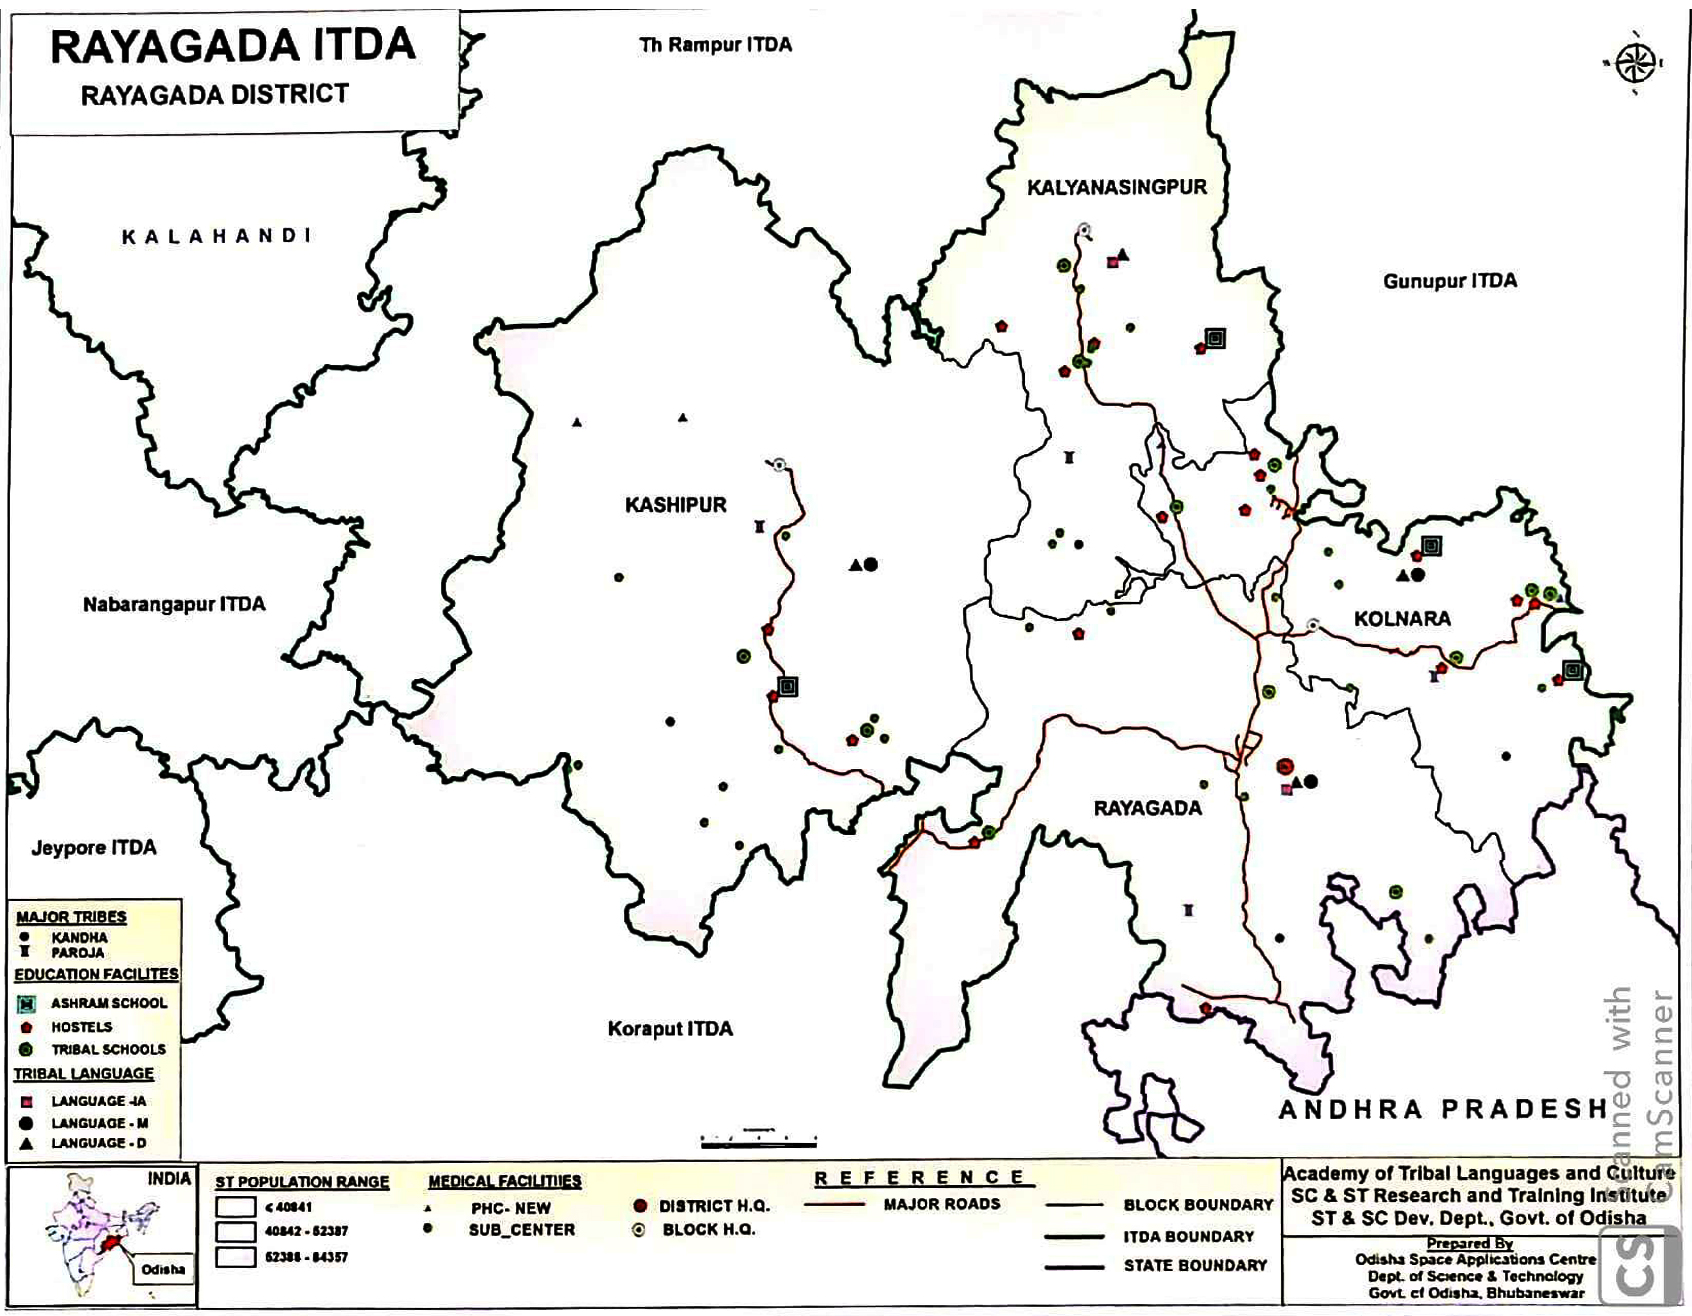
The temperature of the area varies from maximum 450 C to minimum 9.20 C with average annual rainfall of 1600.60 mm. The soil type is loose and loamy with tinges of red and black colour. The major crops grown in the ITDA area are paddy, mustard, arhar, vegetables, ground nut, oilseeds, sunflower and black gram.
As per 2011 Census, the total household of the ITDA area is 95429 and total population is 405558 (Male-195278 & Female-210280) out of which ST population is 259588 (Male-122865 & Female-132723). The average household size of Baripada ITDA is about 4. The total sex ratio is 1077 females per 1000 males where as in case of ST it is 1113 and the total literacy rate of the area is 42.83% whereas ST literacy rate is 32.80%. Kandha, Saora, Paroja, Jatapu are the major tribal communities living in the project area.
ITDA Gunupur
The Integrated Tribal Development Agency (ITDA), Gunupur came into operation from 1st July 1979 under the Societies Registration Act, 1860. Gunupur ITDA belongs to Rayagada district, comprising of 7 blocks such as Bissam-Cuttack, Muniguda, Chandrapur, Ramnaguda, Padmapur and Gudari., 95 GPs and 1475 villages. Gunupur ITDA is surrounded by Paralakhemundi ITDA in East, Rayagada ITDA in West, Baliguda ITDA in North and Andhra Pradesh in South. Gunupur and Bissam-Cuttack are two Tahasils under the jurisdiction of this ITDA. The entire ITDA area comes under the Eastern Ghat region under Rayagada Section of topography. This section of topography has high hills where height varies from 2000-4000 feet. The topography clearly indicates the sparse habitations in the basin. The Bansadhara is the principal river of the region. The basin lies at an average height of 800 metres above sea level. The highest point in the region is the Niyamgiri (1.529 metres) hill range near Bissam-Cuttack and Muniguda blocks. The total geographical area of the ITDA is 5409.86 sq.km. The total forest area of the ITDA is about 777.86 sq.kms.
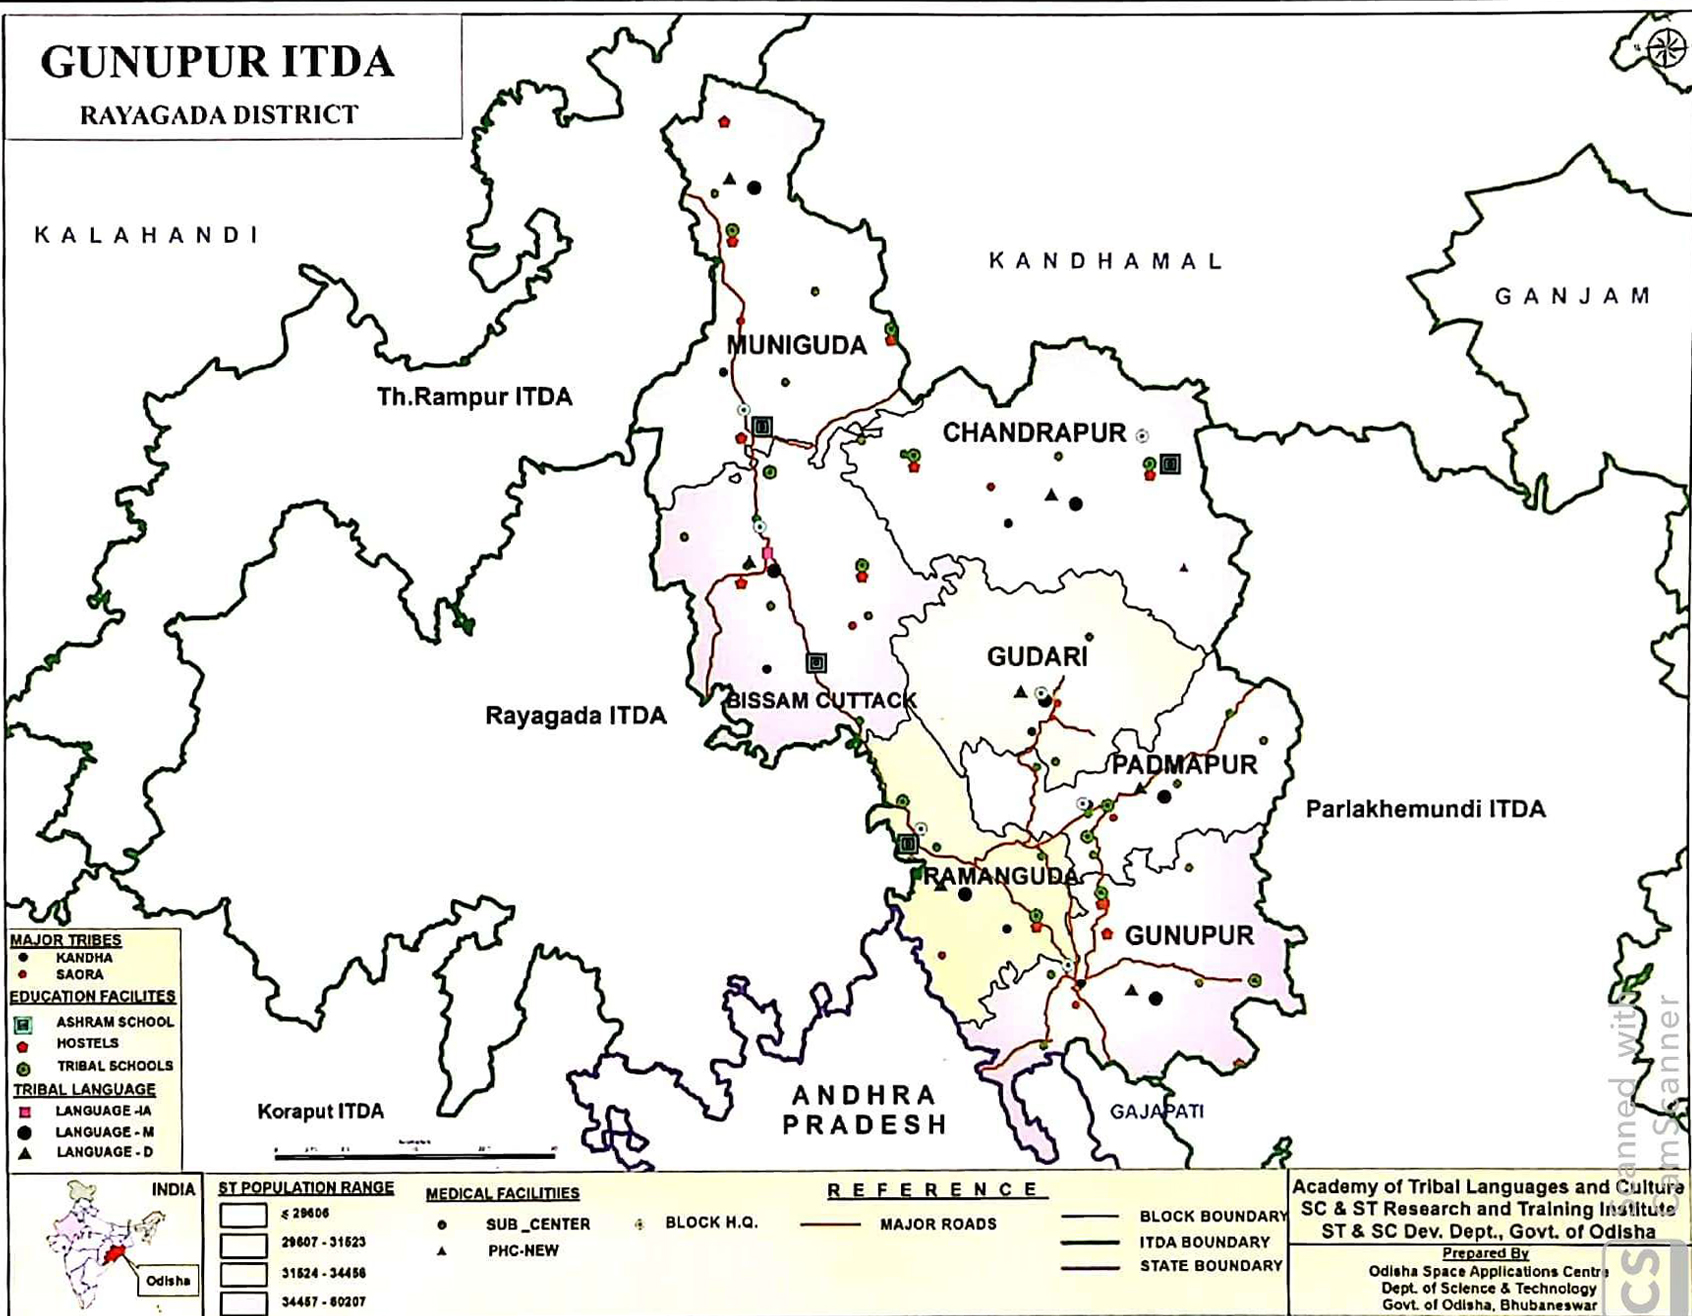
The temperature of the area varies from maximum 430 C to minimum 140 C with average annual rainfall of 1393.5 mm. The soil type is Red lateritic & Alluvial soil. The major crops grown in the ITDA area are paddy, mustard, arhar & sabai grass. As per 2011 Census, the total household of the ITDA area is 107096 and total population is 460052 (Male-225205 & Female-234847) out of which ST population is 268431, comprising of (Male-129427 & Female-139004). The average household size is 4. The Decadal growth rate of population of the area (2001-2011) is 21.72% out of which ST growth rate is 21.45%. The total sex ratio is 1043 females per 1000 males where as in case of ST it is 1074 and the total literacy rate is 49.17% whereas ST literacy rate is 39.49%. Kandha, Saora, Paroja, Jatapu are the major tribal communities living in the project area.
Micro Project: Dongria Kandha Development Agency, (DKDA) Parsali
Dongria Kandha Development Agency, Parsali, was established in the year 1977-88 during 7th Five Year Plan (1985-90) and registered vide resolution No. 12091 (dated.15.04.1988) as Dongria Kandha Development Agency Kalyan Singhpur, with its head quarters at Parsali. At present it is functioning in its own Building at Parsali. It is situated at a distance of 10 kms towards the Niyamgiri hills from Kalyansinghpur Block headquarters, Rayagada district. It is spread over 2 GPs in Kalyan singhpur Blocks of Rayagada District. It comes under the jurisdiction of Rayagada ITDA of Rayagada District. The total geographical area of the project is 50.35 sq.kms. The temperature of the region records 35˚C during summer and at 0˚C-2˚C in winter. The monsoon reaches by the second week of June and continues up to September. July and August months are having maximum rain fall in this area. Humidity is very high in the monsoon and post-monsoon period. The type of soil found in the area is Red Lateritic Group.
As per the Micro Project profile, Parsali covers 727 Households in 36 villages with a total population of 2831 (1197 male & 1634 female). Their growth rate is (from 2010-15) 10.41% and the sex ratio is 1365 per 1000 male. The density of population in the micro project area is 56 per sq.kms. and average household size is 4. The total literacy rate of the Dongria Kandha of the Micro Project is 25.01%. The literacy rate for male is 30.83% and the female literacy rate is 20.75%. Kuvi-a Dravidian Language is their mother tongue. They basically depend on settled cultivation, Shifting cultivation, MFP collection and wage earning. They are specially shifting cultivators and expert horticulturists. They are having linear settlement pattern in the Dravidian style. They observe Kodru Parba, Dhan Nuakhai, Dongar Puja, Meria Puja, Bihan Puja, Punapadi, Pidika, Mandia Rani, Salang as their festivals. Their major dance forms are Kedu Dance, Bali Parab, Dhap Dance and Meria Parab dance.
Micro Project: Lanjia Saora Development Agency, (LSDA) Puttasing
Lanjia Saora Development Agency, Puttasing was established on 1st April 1984 during 6th Five Year Plan (1980-85) and registered under Society Registration Act, 1860. It’s head quarters is located at Puttasing of Rayagada district. It is located 20 kms away from Gunupur Block of Rayagada District. At present it is functioning in its own Building at Puttasing. It spreads over one GP in Gunupur Block of Rayagada District. It comes under the jurisdiction of Gunupur ITDA of Rayagada District. The Lanjia Saora Development Agency, Puttasing is situated as a part of a high land lying about 2,000ft above the sea level. The total geographical area of the project is 35sq.kms. As such it has undulating terrain with rolling hills, valleys, perennial streams and patches of forests here and there. The project area is ruggedly mountainous, so the area experiences a moderate climate, with a short and mild summer, moderate monsoon and a long winter. The type of soil found in the area is Red Lateritic Soil.
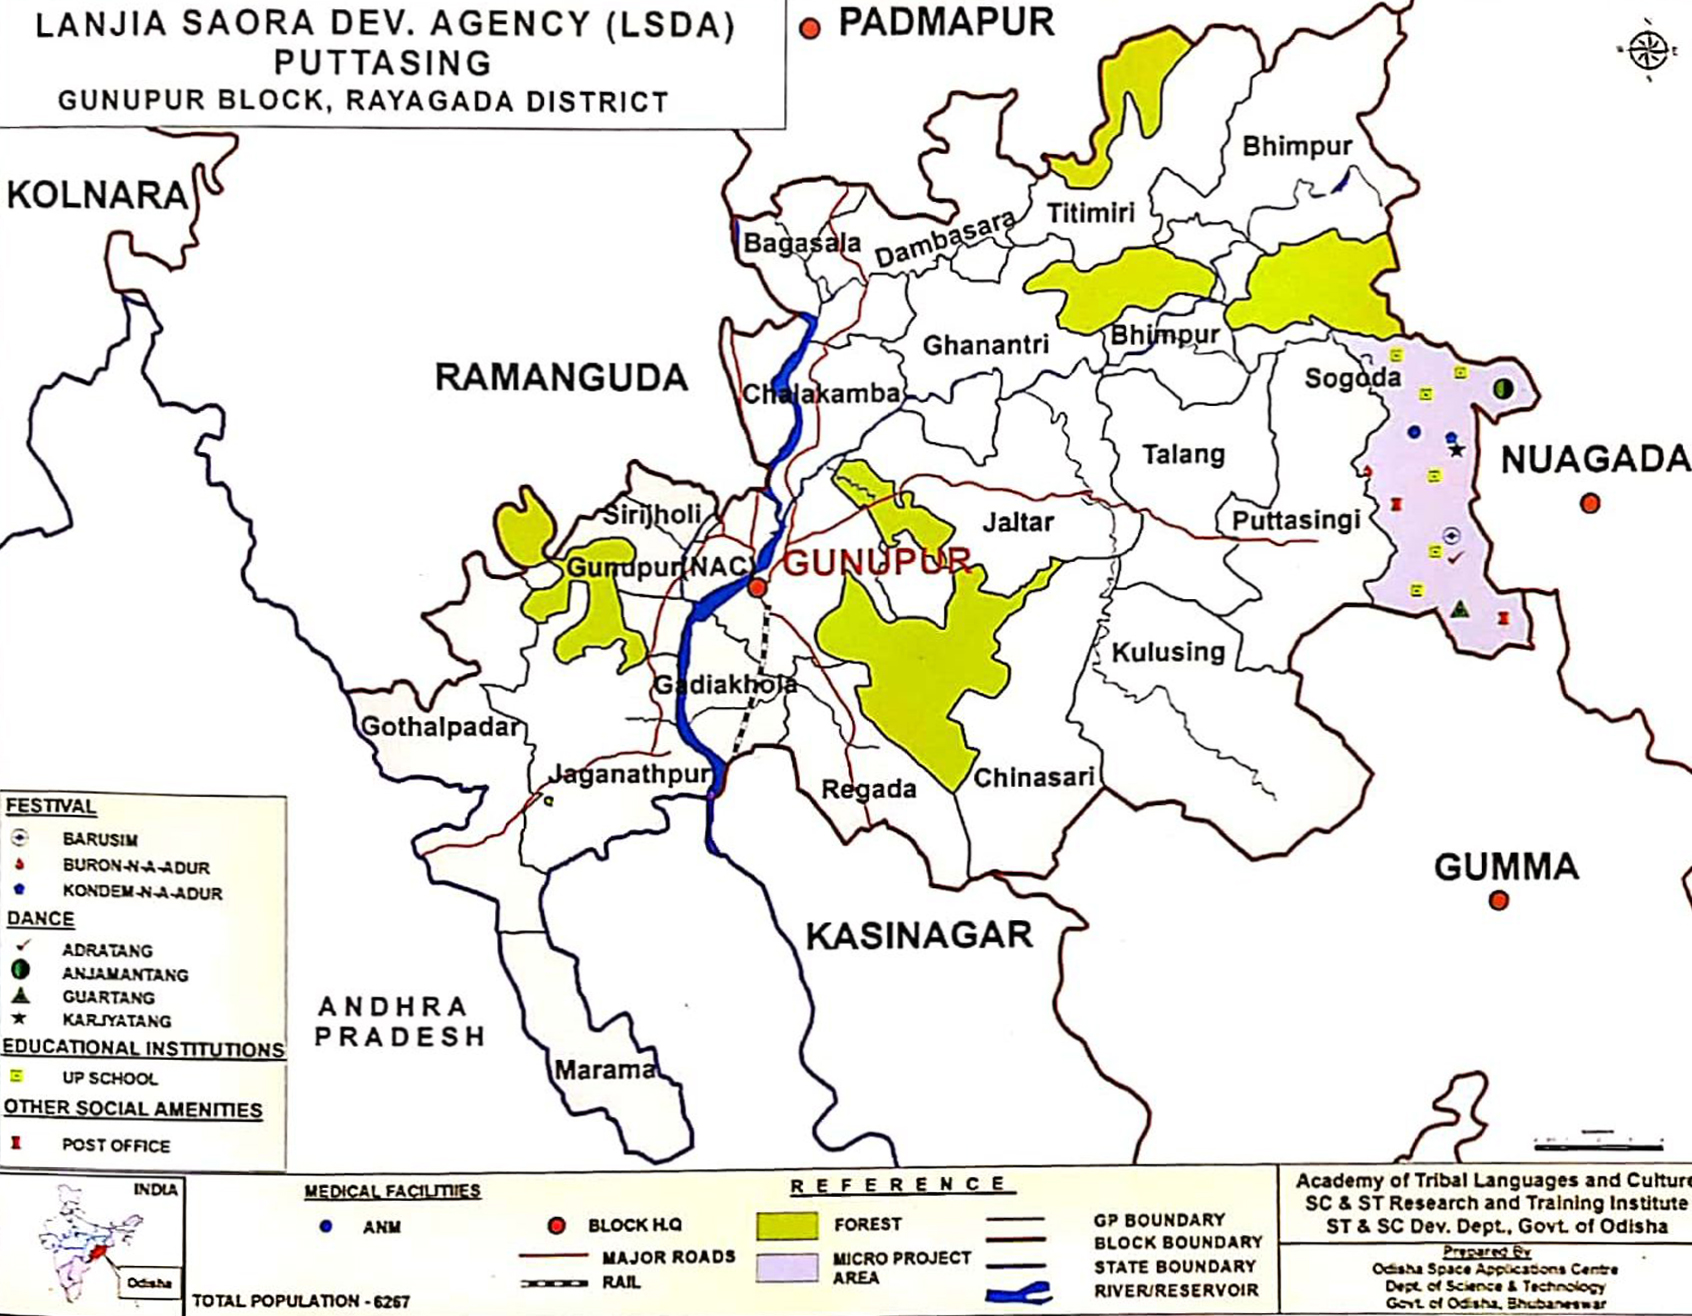
LSDA, Puttasing covers 1294 households in 20 villages with a total population of 6574 (3173 male & 3401 female). Their growth rate is (from 2010-15) 10.30% and the sex ratio is 1072 per 1000 male. The density of population of the area is 188 per sq.kms and the average household size is 5. The total literacy rate of the Lanjia Saora is 46.64%. The literacy rate for male is 46.49% and the female literacy rate is 46.78%. Sora-a Munda Language is their mother tongue. They basically depend on settled cultivation (Terracing), shifting cultivation, forest collection, hunting and wage earning. They are having scattered housing pattern. They observe Barusim, Buron-n-a-Adur, Kondem-n-a-Adur. Their major Dance forms are Guartang, Karjyatang, Adratang and Anjamantang Dance.
Micro Project: Dongria Kandha Development Agency, (DKDA) Kurli, Chatikona
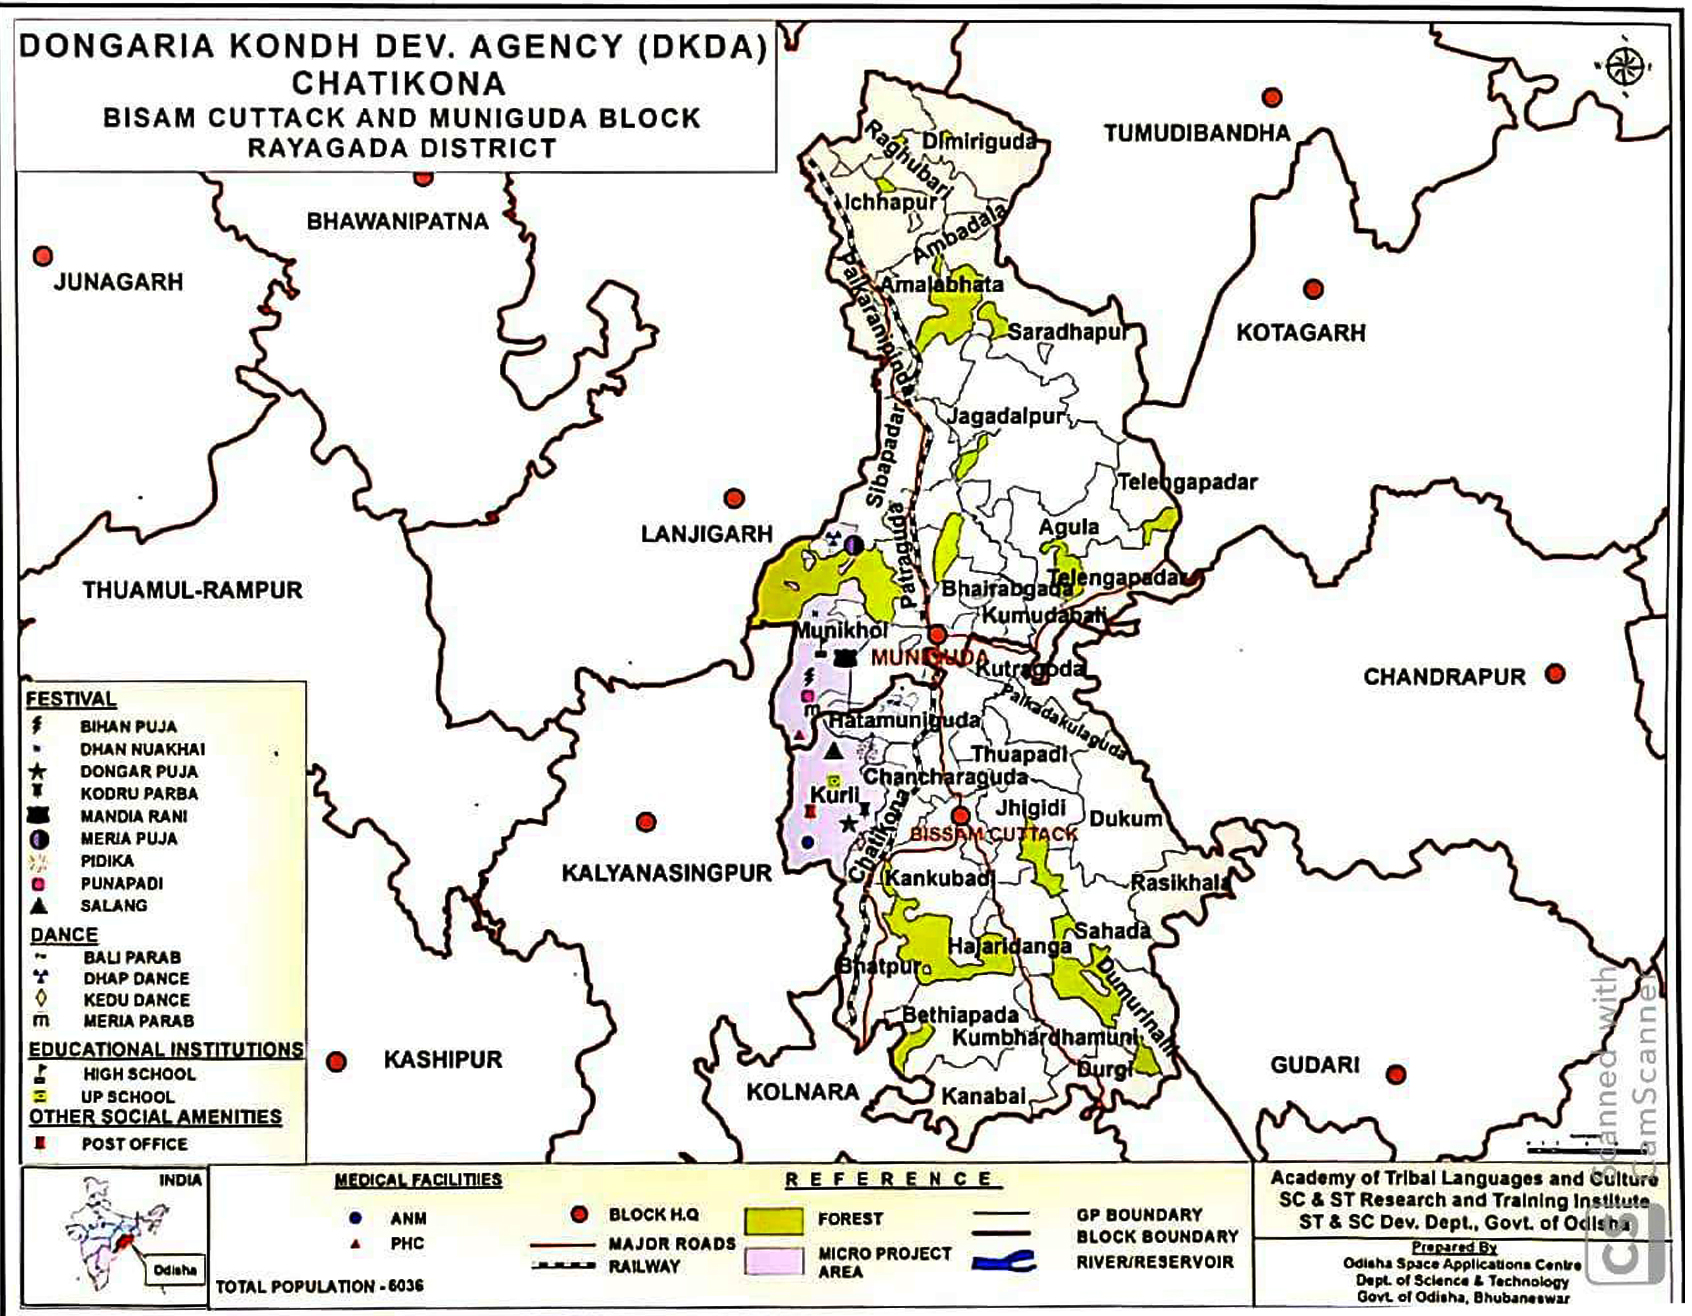
Dongria Kandha Development Agency, Kurli, was established in the year (1978-79) during Annual Plan (1979-80) and registered under the Society Registration Act, 1860. Presently it is functioning in its own Building at Chatikona. It is spread over 5 GPs. Bisam Cuttack and Muniguda Blocks of Rayagada District. It comes under the jurisdiction of Rayagada ITDA of Rayagada District. The total Geographical area of the project is 115.00sq.kms. The type of soil is Rocky and Stony Group.

DKDA, Kurli covers 1633 Households in 62 villages with a total population of 6765 (2879 male & 3886 female). Their growth rate is (from 2010-15) 7.28% and the sex ratio is 1350 per 1000 male. The density of population of the area is 59 per sq.kms and the average household size is 4. The total literacy rate of the Dongria Kandha of the Micro Project is 32.89%. The literacy rate for male is 48.32% and the female literacy is 21.46%. Kuvi-a Dravidian Language is their mother tongue. They basically depend on settled cultivation, shifting cultivation, MFP collection and wage earning. They are specially shifting cultivators and expert horticulturist, having linear housing pattern in the Dravidian style. They observe Kodru Parba, Dhan Nuakhai, Dongar Puja, Meria Puja, Bihan Puja, Punapadi, Pidika, Mandia Rani, Salang as their festivals. Their major dance forms are Kedu Dance, Bali Parab, Dhap Dance and Meria Parab dance.
Demography and Development Indicators
Demography
An overview of the demography of the tribals as a whole in the district of Rayagada shows that as per 2011 Census, the district has 5,41,5905 tribal population out of which 2,82,865 are female & 2,59,040 are male. This shows that the sex ratio favour of the females in the district which is 1092 female per 1000 male.
- Total population : 967911 (Male-471960 & Female-495951)
- ST population : 541905 (Male-259040 & Female-282865)
- Child population (0-6) : All-148522 & ST-91675
- Sex Ratio : All-1051 & ST-1092
- Child Sex Ratio : All-965 & ST-963
- Growth Rate : ALL-16.46 & ST-17.00
- Literacy Rate : All-49.76 & ST-36.69
- Female Literacy Rate : All-39.19 & ST-26.72
- Gender Gap in Literacy : All-21.86 & ST-21.15
- Worker (in lakh) : All-4.68 & ST-2.83
- WPR : All-48.26 & ST-52.22
- Scheduled Tribe Population
|
ST |
2001 |
2011 |
|
Total |
463418 |
541905 |
|
Male |
224908 |
259040 |
|
Female |
238510 |
282865 |
|
Child Poulation(0-6) |
88908 |
91675 |
During 2011, out of Total ST Population 47.80% are male and 52.19% are female. The ST Child Population of the district is 61.72% of total child population of the district. Looking at the population growth rate of tribals as per 2011 Census, there has been an increased of 17% population between 2001 and 2011 Census over a period of 10 years. The work force participation rate indicates that 52.22% population are workers. The disaggregated data reveals that 49.80% and 50.20% are male and female workers respectively. Similarly, the dependancy ratio of the total population of the district is 0.74 : 1 and for the ST category is 0.84:1.
- Education
During the last decade the literacy rate has been considerably increased. According to 2011 Census the literacy rate of the tribal population stands at 36.69% whereas the female literacy rate is 26.72%.
- Literacy Rate (Census-2011)
|
Category |
Total |
Male |
Female |
|
All |
49.76 |
61.04 |
39.19 |
|
Scheduled Tribe |
36.69 |
47.87 |
26.72 |
- Drop Out Rate (2016-17)
|
Category |
Primary |
Upper Primary |
Elementary |
|
All |
9.04 |
10.63 |
9.84 |
|
ST |
13.23 |
11.43 |
12.33 |
|
Girls |
9.22 |
10.70 |
9.96 |
- SSD Department Schools
|
Category |
Number |
|
High School |
31 |
|
Ashram School |
41 |
|
Educational Complex |
3 |
|
Sevashram (Res) |
1 |
|
Ekalavya Model Residential School (EMRS) |
1 |
|
Hostel |
647 |
[/tab]
Development Indicators
- Human Development Index (2001) : 0.443 (rank 17)
- Gender Development Index (2001) : 0.428 (rank 06)
- Infrastructure Development Index (2001) : 84.37 (Rank 23)
- Gross District Domestic Products ( At 2004-05 Price) : 240093 for 2009-10
- Dependency Ratio : All-0.74:1, ST-0.84:1 & SC-0.74:1
- Female Literacy Rate : All-39.19, ST-26.72 & SC-41.46
- Gross Enrolment Ratio
- Total : 95.39
- Primary : 92.60
- Upper Primary : 102.77
- Dropout Rate :
- Primary : All-9.04, ST-13.23 & SC-6.61
- Upper Primary : All-10.63, ST-11.43 & SC-11.15
- Elementary : All-984, ST-12.33 & SC-8.88
- IMR (As per Annual Health Survey 2012-13) : 58
- MMR (As per Annual Health Survey 2012-13) : 19
- CBR (As per Annual Health Survey 2012-13) : 22.5
- CDR (As per Annual Health Survey 2012-13) : 8.4
- Institutional Delivery (%) : 62.3
- Full Immunisation (%) : 77 :
- Nutrition Status
- Height-for-age : 43.5
- Weight-for-height- : 23.1
- Weight-for-age- : 42.4
- Average Land Holding : All Groups-1.22, ST-1.17 & SC-0.87
- Percentage of children having any anaemia (<11.0 g/dl)- : 49.8
- Percentage of women having any anaemia (<12.0 g/dl)1- : 55.4
- Women with BMI <18.5 (total thin)- : 31.1
- Women with BMI ≥25.0 (overweight or obese)- : 10.0
Districtwise Targets and Achievements of SDC
2018-19
|
Indicator |
Target |
|
Artisan Cards |
6000 |
|
Bilingual Dictionary |
1 |
|
Block Level Cultural Festival |
11 |
|
Block Level Sports |
11 |
|
Dance Costumes |
22 |
|
District Level Cultural Festival |
1 |
|
District Level Sports |
1 |
|
Exposure Visits |
943 |
|
Musical Instrument |
182 |
|
Sacred Groves |
200 |
|
Skill Dev Training |
500 |
|
Sports Kit |
50 |
|
State Level Sports |
1 |
|
Tribal Culture Clubs |
182 |
|
Tribal Museum |
1 |
|
Trilingual Proficiency Module |
1 |
|
Weekly Haat |
22 |
Office Bearers
-
Executive Committee
Executive committee for district:
No.
DESIGNATION
OFFICE BEARERS
1
Chairperson
District Collector
2
Member
Project Director, DRDA
3
Members
District Level Officers to be copted by the District Collector (District Level Officers should include deputy Director of Agriculture, CDMO, Cl of Schools, DFO, District Culture Officer, District Sports Officer, DWO, Special Officers of Micro Projects if any, DI & PRO)
4
Member
Director, DPMU
5
Member
Project Administrator (s), ITDA (s)
6
Member Secretary
The Project Administrator, ITDA located at the District Headquarter or located nearest to the District Head Quarter in case of the Districts having no Head Quarter ITDA
Major Tribes
Download: Communitywise and Sectorwise distribution of Schedule tribes


